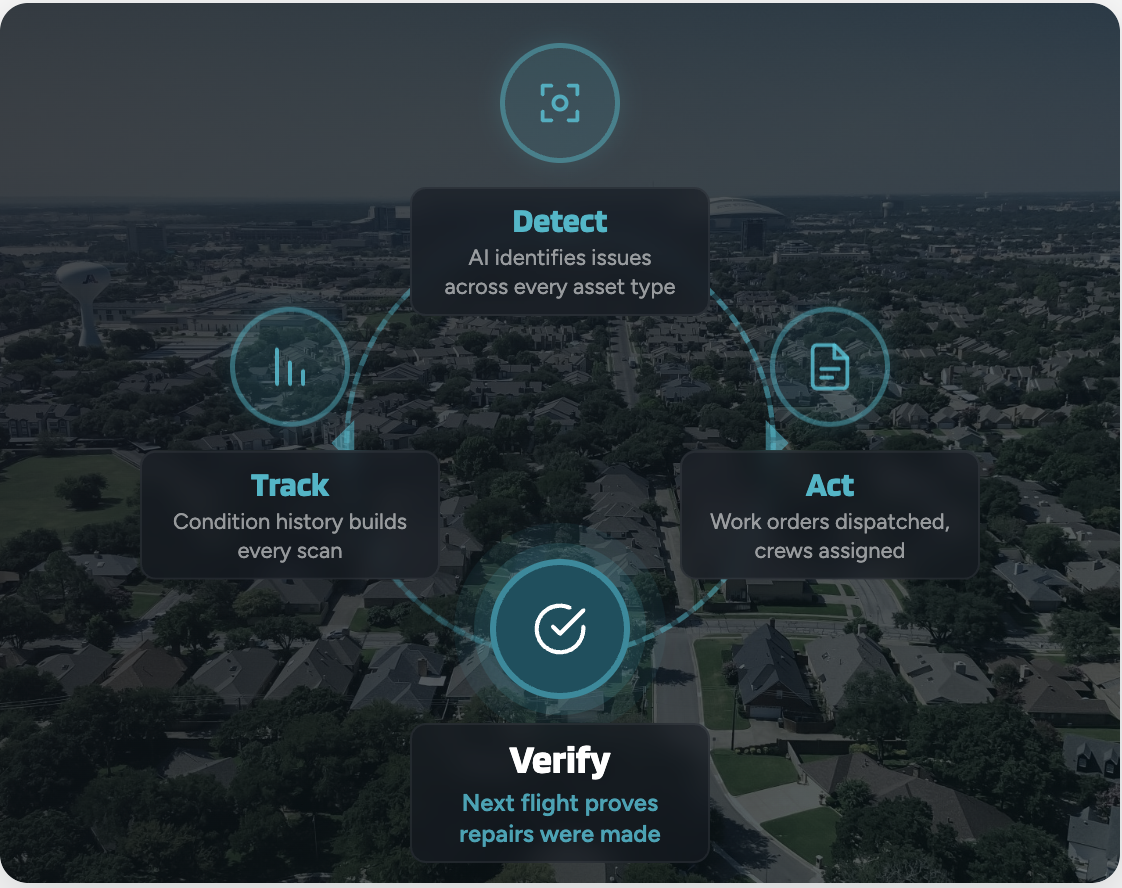
From Flight to Action
in Four Steps

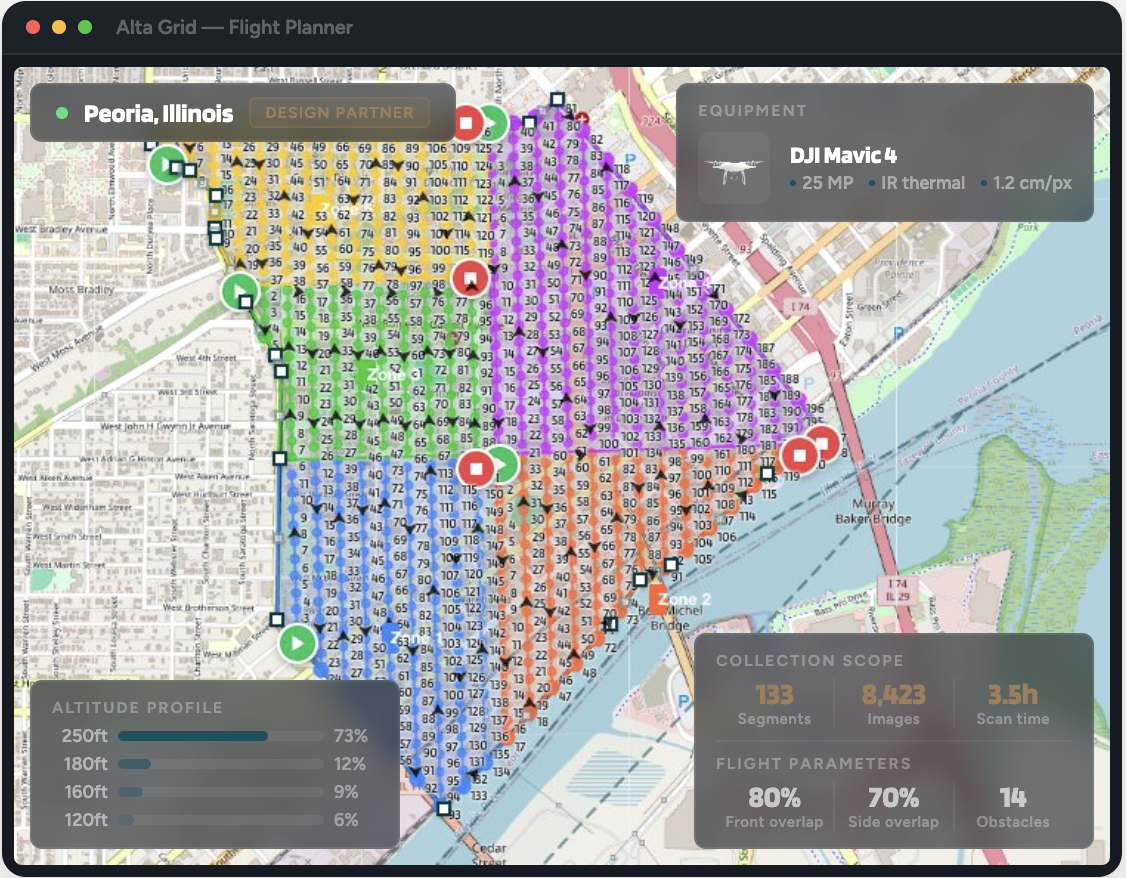
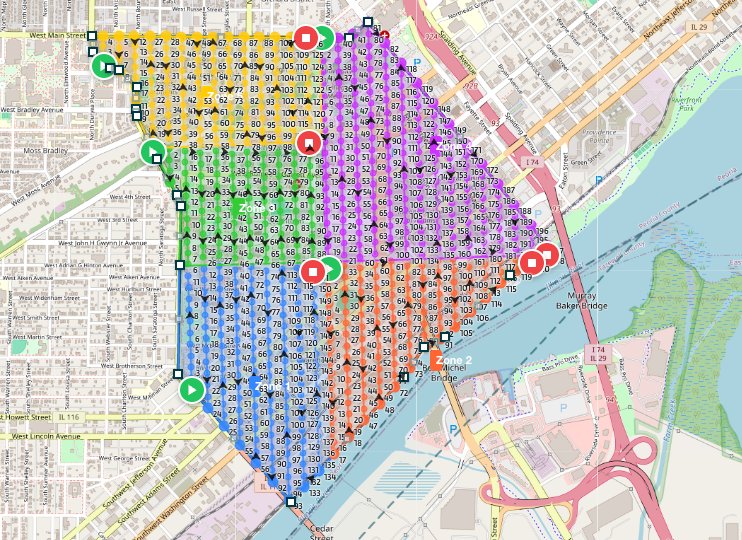
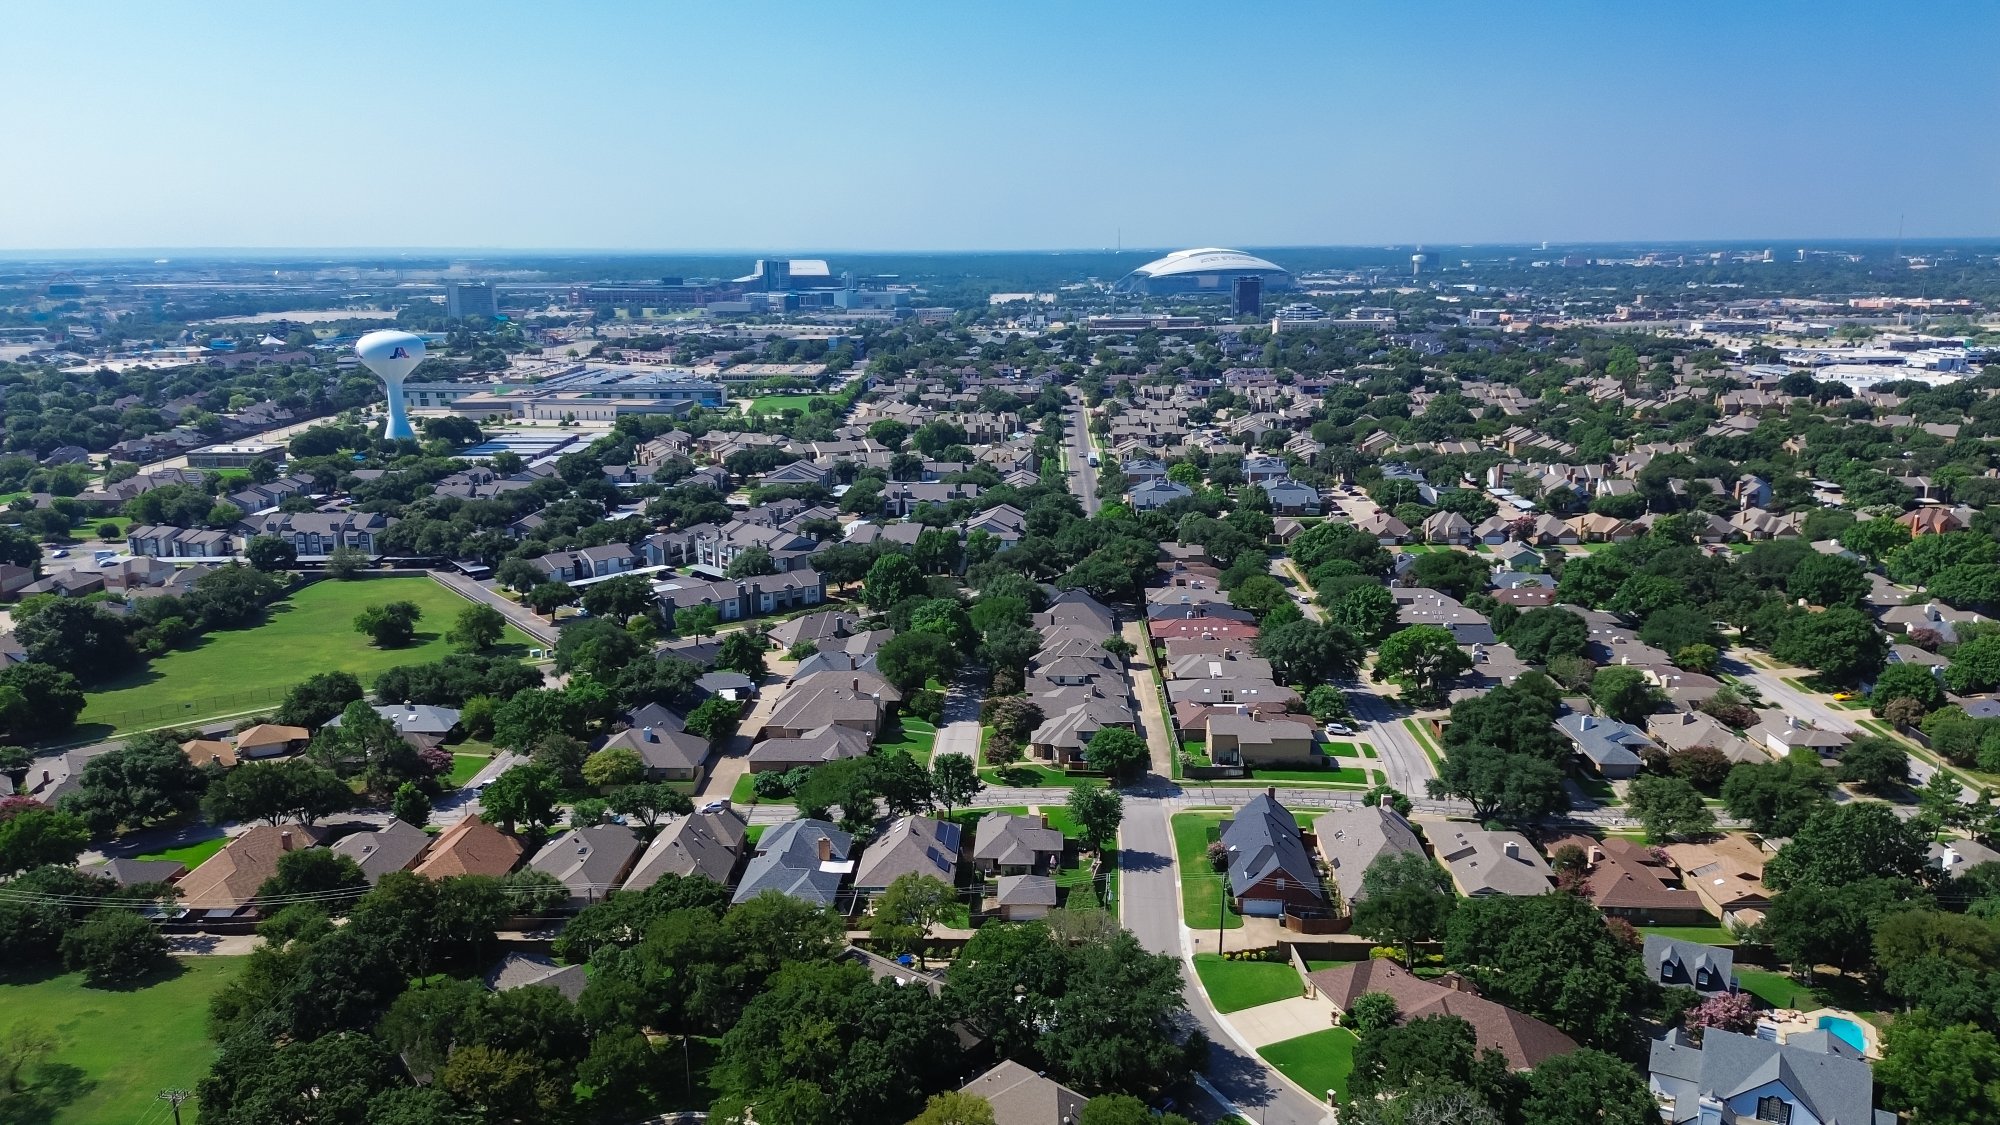
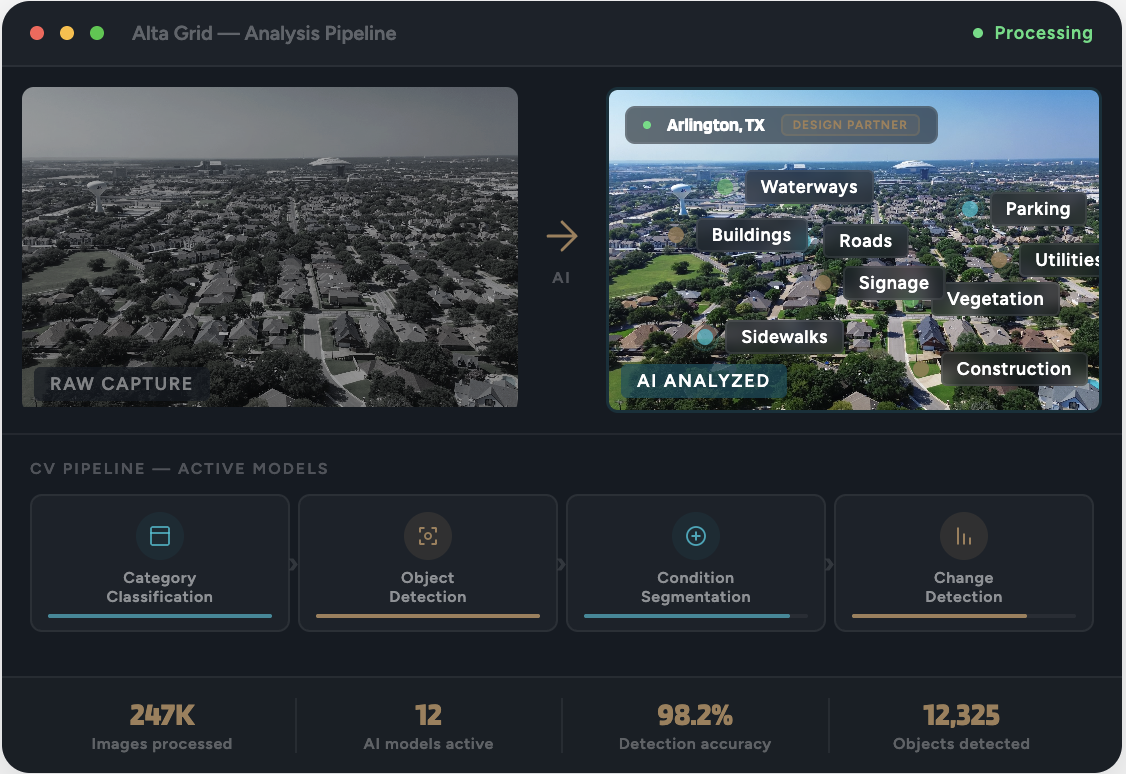
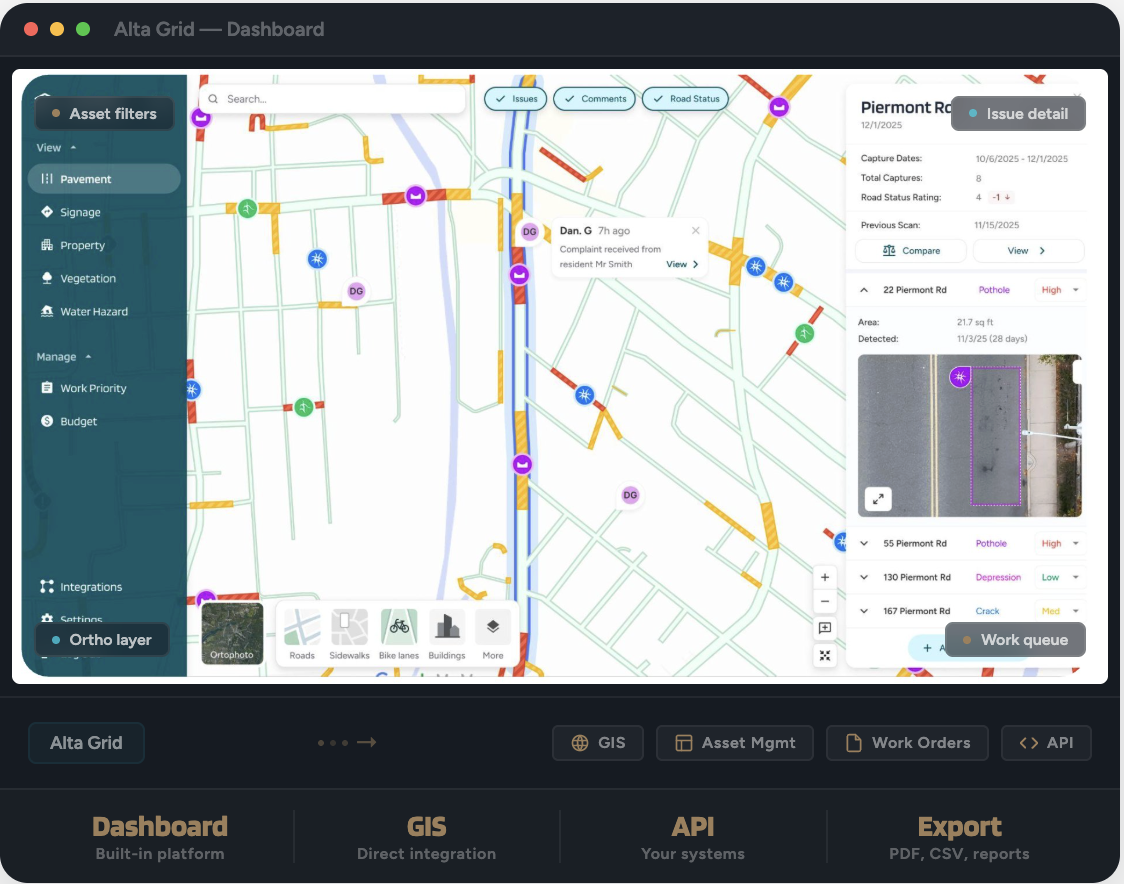
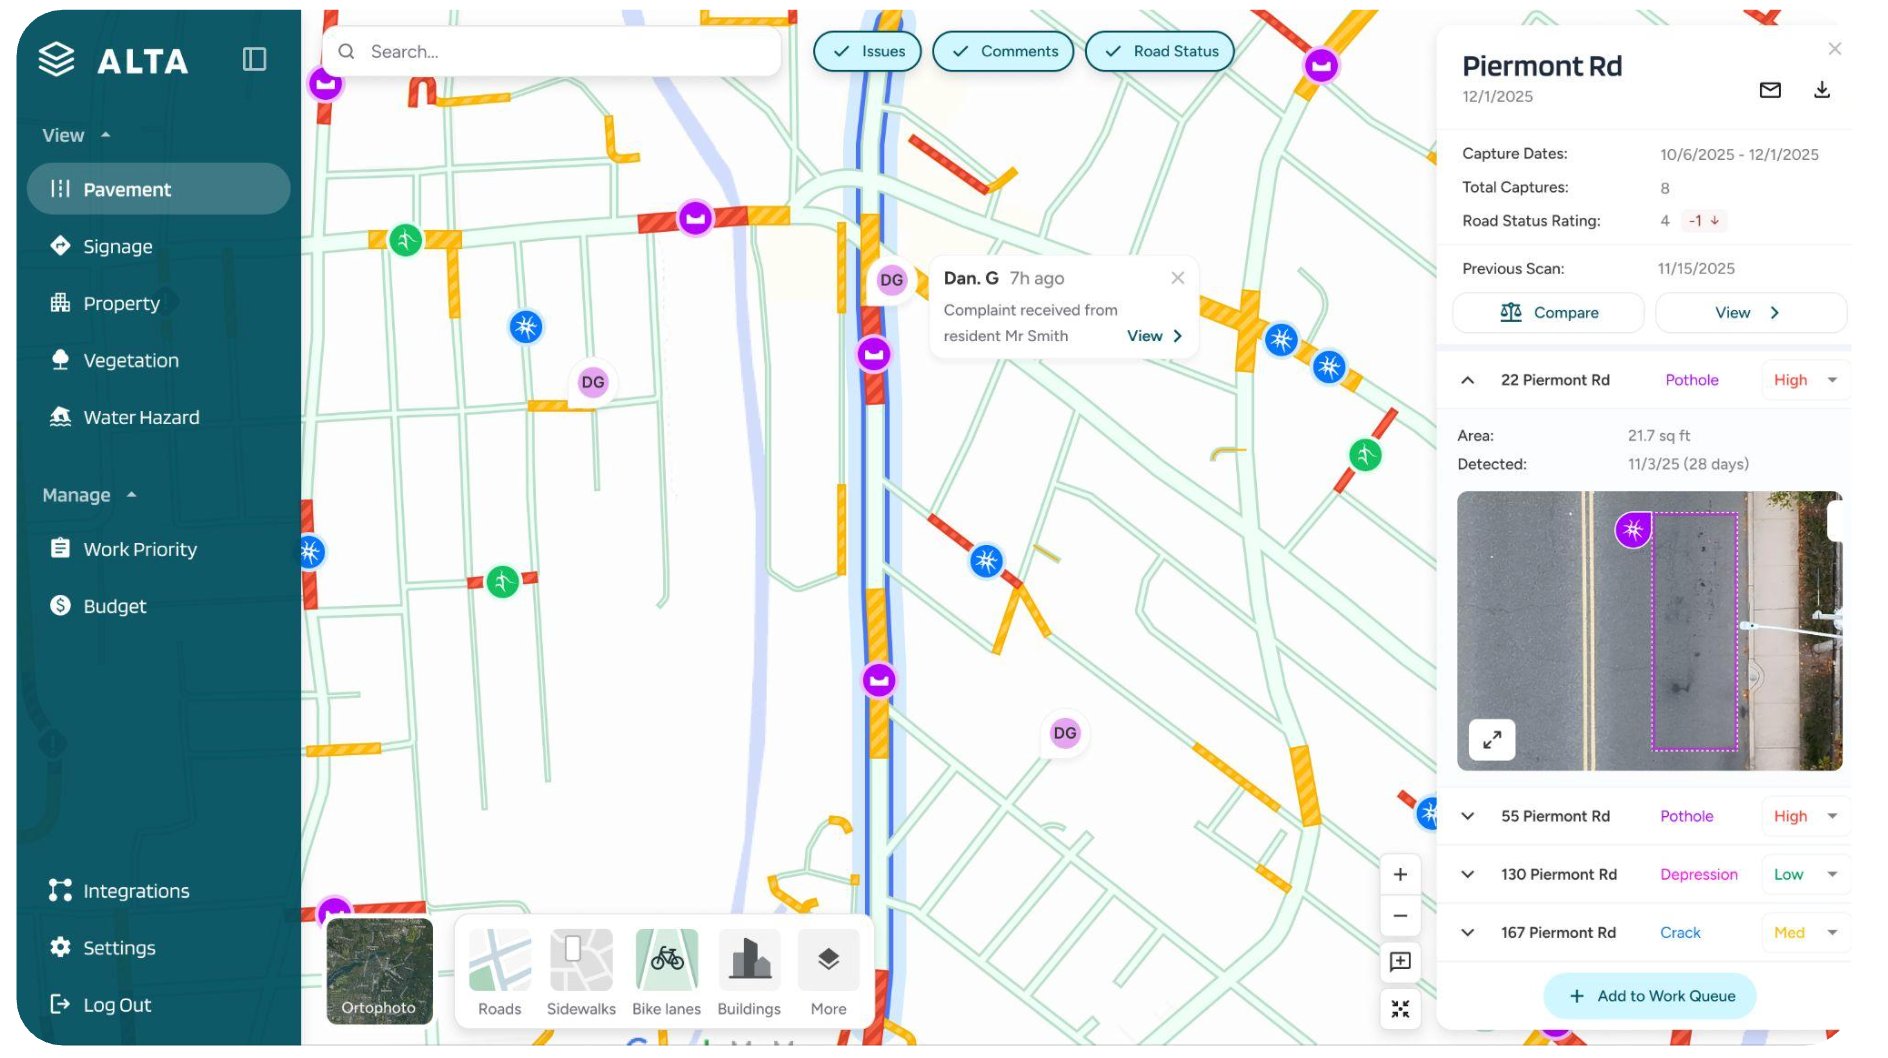
Alta Grid combines automated drone collection, computer vision analysis, and integrated reporting to give your team a complete, continuously updated picture of infrastructure condition — with a direct path to action.

No vehicle-mounted hardware
Our drones or yours
Monthly or quarterly
Survey drone
1
Collect
City-wide drone data capture. All asset types in one flight.
2
Analyze
AI-powered detection, classification, and condition assessment.
3
Report
Interactive dashboards, analytics, and prioritization tools.
4
Verify & Track
Automated verification, accountability, and condition tracking.
1
Collect

Drone-Based City-Wide
Data Capture

Every collection starts with rigorous planning. Our proprietary system analyzes your city's terrain, obstacles, and asset density to generate optimized flight paths — then drones execute with precision.

All asset types in a single collection flight
Our drones or your existing fleet
No vehicle-mounted hardware needed
Proprietary mission planning — optimized altitude, overlap, and routing for every city block
Adapts to any drone platform, terrain type, and weather conditions
Monthly or quarterly — at whatever cadence your city needs
1,000X
more efficient than manual inspection
Alta Grid Flight Planner showing optimized drone routes over Peoria, IL
Alta Grid — Flight Planner
Alta Grid flight planner — Peoria, IL
Peoria, Illinois
Design Partner
Equipment
DJI Mavic 4
DJI Mavic 4
25 MP
IR thermal
1.2 cm/px
Altitude Profile
250ft
73%
180ft
12%
160ft
9%
120ft
6%
Collection Scope
133
Segments
8,423
Images
3.5h
Scan time
Flight Parameters
80%
Front overlap
70%
Side overlap
14
Obstacles
Alta Grid — Analysis Pipeline
Processing
Raw aerial imagery — Arlington, TX
Raw capture
AI
AI-analyzed imagery — Arlington, TX
Arlington, TX
Design Partner
Roads
Buildings
Vegetation
Sidewalks
Parking
Signage
Utilities
Construction
Waterways
AI analyzed
CV Pipeline — Active Models
Category
Classification
Object
Detection
Condition
Segmentation
Change
Detection
247K
Images processed
12
AI models active
98.2%
Detection accuracy
12,325
Objects detected
2
Analyze

AI-Powered Detection,
Classification & Assessment

Raw aerial imagery flows through our computer vision pipeline. Multiple AI models run simultaneously across every image — classifying, geolocating, and rating the condition of every asset detected.

Multiple AI models run in parallel — pavement, signs, vegetation, structures, and more
Every detected asset is classified, geolocated, and given a condition score
Optimized for city-scale data — hundreds of thousands of images per collection
Models improve with every collection cycle through continuous feedback
Category classification
Object detection
Condition segmentation
Change detection
Geolocation
Defect scoring
AI analysis pipeline showing raw vs analyzed aerial imagery with detected assets
3
Report

Your Data, Your Way —
Dashboard or Integration

Access your intelligence through our interactive dashboard — or feed it directly into the GIS, asset management, and work order systems your team already uses. Your data, your workflows.

Alta Grid dashboard — city-wide maps, street-level detail, prioritization tools
Integrates with your existing GIS, asset management, and work order systems
Compare scans over time — track deterioration, verify repairs, measure progress
Export reports for council, budget requests, and grant applications
Alta Grid dashboard
GIS integration
Asset management sync
API access
PDF / CSV export
Alta Grid dashboard with city map, asset details, and integration flow
Alta Grid — Dashboard
Alta Grid Dashboard — city map with asset condition data, detail panel, and work queue
Asset filters
Issue detail
Ortho layer
Work queue
Alta Grid
GIS
Asset Mgmt
Work Orders
API
Dashboard
Built-in platform
GIS
Direct integration
API
Your systems
Export
PDF, CSV, reports
4
Verify & Prove

Verify, Track &
Prove Impact

Here's what makes recurring collection transformative: every flight doesn't just find new issues — it verifies that previous ones were fixed. No manual re-inspection. No crew self-reporting. The data proves what happened.

Every scan compares against the last — what changed, what was fixed, what got worse
Repairs verified by drone, not by the crew that did the work — objective accountability
Track deterioration trends over time — predict where problems emerge next
Prove ROI to council — show exactly what improved, scan by scan
Accountability loop: Detect, Act, Verify, Track
Detect
AI identifies issues across every asset type
Act
Work orders dispatched, crews assigned
Verify
Next flight proves repairs were made
Track
Condition history builds every scan

Want to See What This Looks Like for Your City?

Get in Touch →

Why Frequency Changes Everything

Traditional methods weren't built for continuous infrastructure intelligence.

Traditional Methods
Alta Grid
Update frequency
Every 2–3 years
Monthly or quarterly
Asset coverage
One type per survey
All types in one flight
Hardware required
Vehicle-mounted cameras
None — drones deploy independently
Objectivity
Inspector-dependent, subjective
AI-consistent, objective
Change detection
Not available
Automatic scan-to-scan tracking
Repair validation
Manual re-inspection
Automated by next flight
Prioritization
Complaint-driven
Data-driven, condition-based
Alta Grid
  • Monthly or quarterly update frequency
  • All asset types in one flight
  • No hardware — drones deploy independently
  • AI-consistent, objective assessment
  • Automatic scan-to-scan change tracking
  • Automated repair validation by next flight
  • Data-driven, condition-based prioritization
Traditional Methods
  • Updated every 2–3 years
  • One asset type per survey
  • Requires vehicle-mounted cameras
  • Inspector-dependent, subjective
  • Change detection not available
  • Repairs require manual re-inspection
  • Complaint-driven prioritization

See What Alta Grid Can Detect in Your City

30 minutes. Real data. No commitment.

Get in Touch →